

April 27 Landsat Webviewer
 Alabama was severely impacted by the severe weather outbreak of April 27, 2011, which led to 69 tornadoes
and over 250 fatalities within the state. Additional information on the outbreak, including individual
tornado damage surveys and damage photos can be obtained from the National Weather Service Weather Forecast Offices in Birmingham,
Huntsville, and Mobile.
Alabama was severely impacted by the severe weather outbreak of April 27, 2011, which led to 69 tornadoes
and over 250 fatalities within the state. Additional information on the outbreak, including individual
tornado damage surveys and damage photos can be obtained from the National Weather Service Weather Forecast Offices in Birmingham,
Huntsville, and Mobile.
This projected combined imagery from Landsat-5, Landsat-7 ETM+ and Landsat-8. With the help from USGS, surface reflectances were calculated for all the imagery, to provide the data in its best format.
NOTE: Landsat-7 experienced an anomaly early on its mission, which is why the stripes appear in the imagery of 2012.
Landsat Imagery
The SPoRT team acquired 30 m spatial resolution imagery from Landsat 5, Landsat 7, and Landsat 8 in collaboration with the US Geological Survey (USGS). As these imagers sample the same point once every 16 days, imagery was selected in the months of May through early September to capture periods with reduced cloud cover and near peak annual greenness throughout the state. The imagery is provided in a viewer that allows users to interactively look at landscape change that occurred as a result of the April 27, 2011 outbreak, observe some of the region's recovery, and examine other changes that have occurred during the recovery process. Products shown in the viewer include:
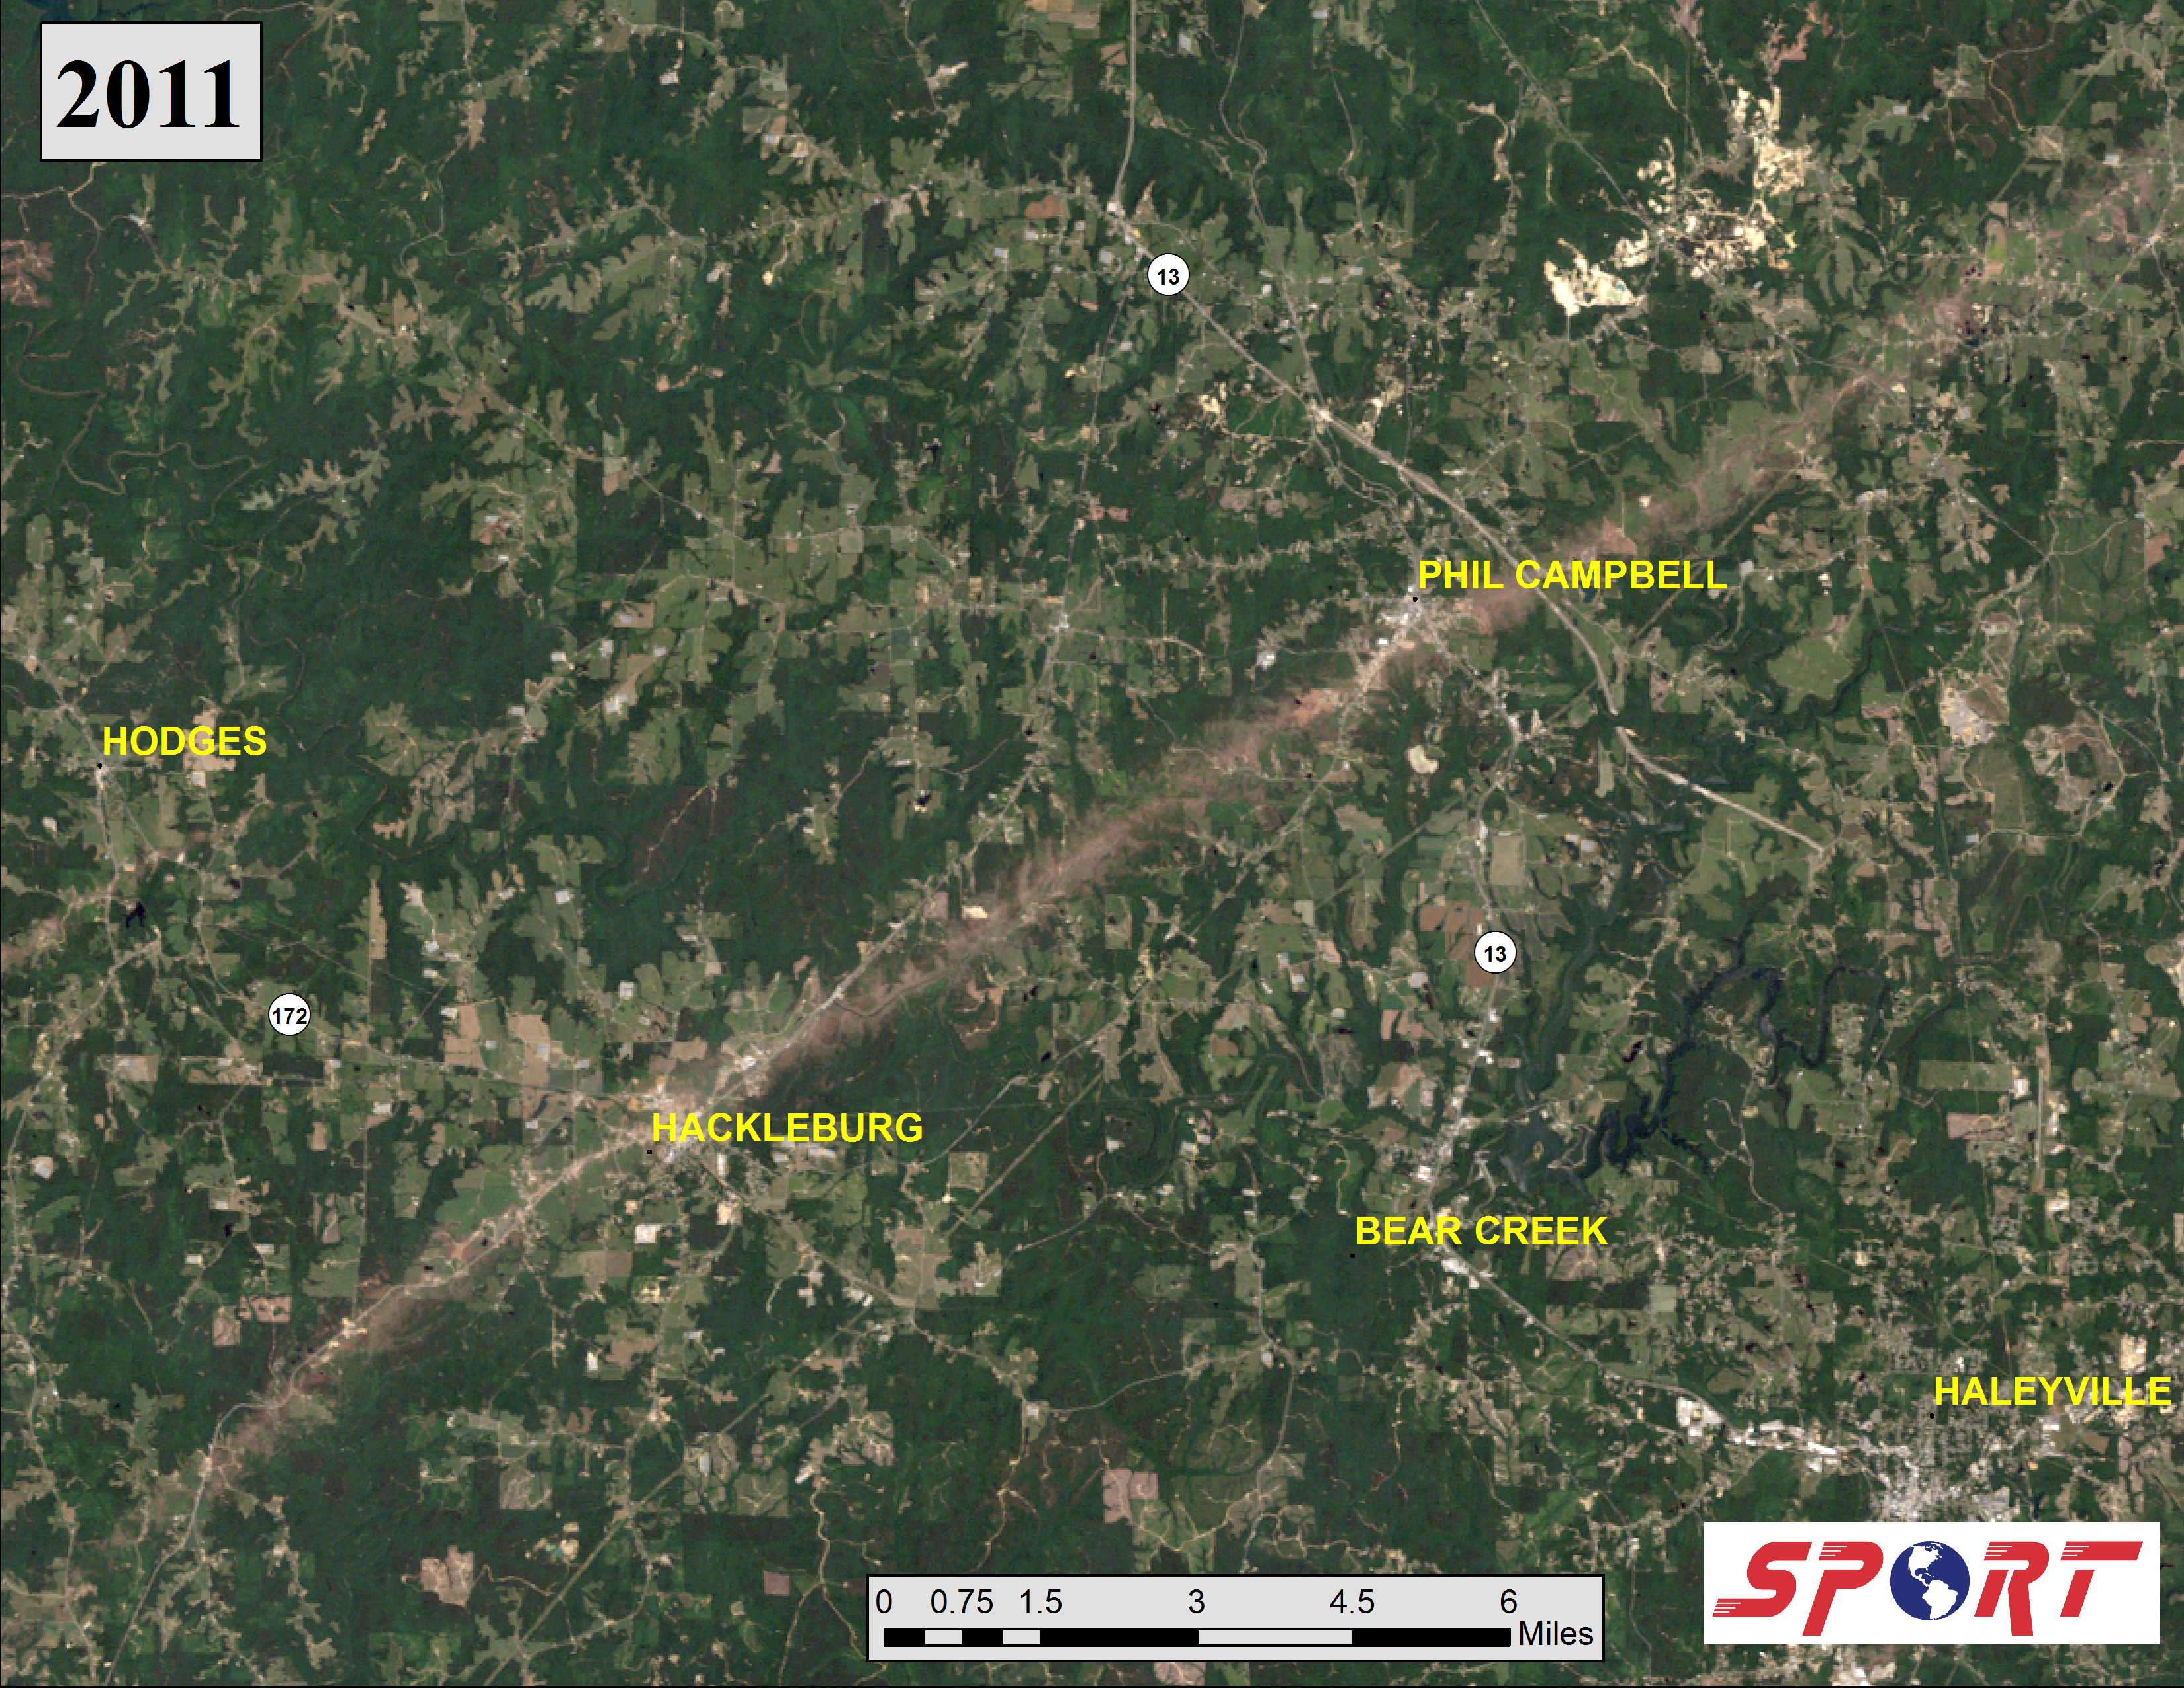
True Color: True color imagery provides a representation of what your eyes would see from space. This product combines reflected light in the red, green, and blue visible wavelengths to produce the final image. Areas of vegetation appear in shades of green, urban areas in shades of gray, white, or tan depending upon the types of materials present. Some tornado damage scars are present as browned features in 2011 where tornadoes removed vegetation and left the underlying soils exposed. In later years, some of these tracks are present but perhaps less evident, primarily as changes in overall coloration as some of the trees that were removed have been replaced with other types of ground vegetation. In the figure to the right, a portion of a tornado damage track is evident from Hackleburg, AL to Phil Campbell, AL.
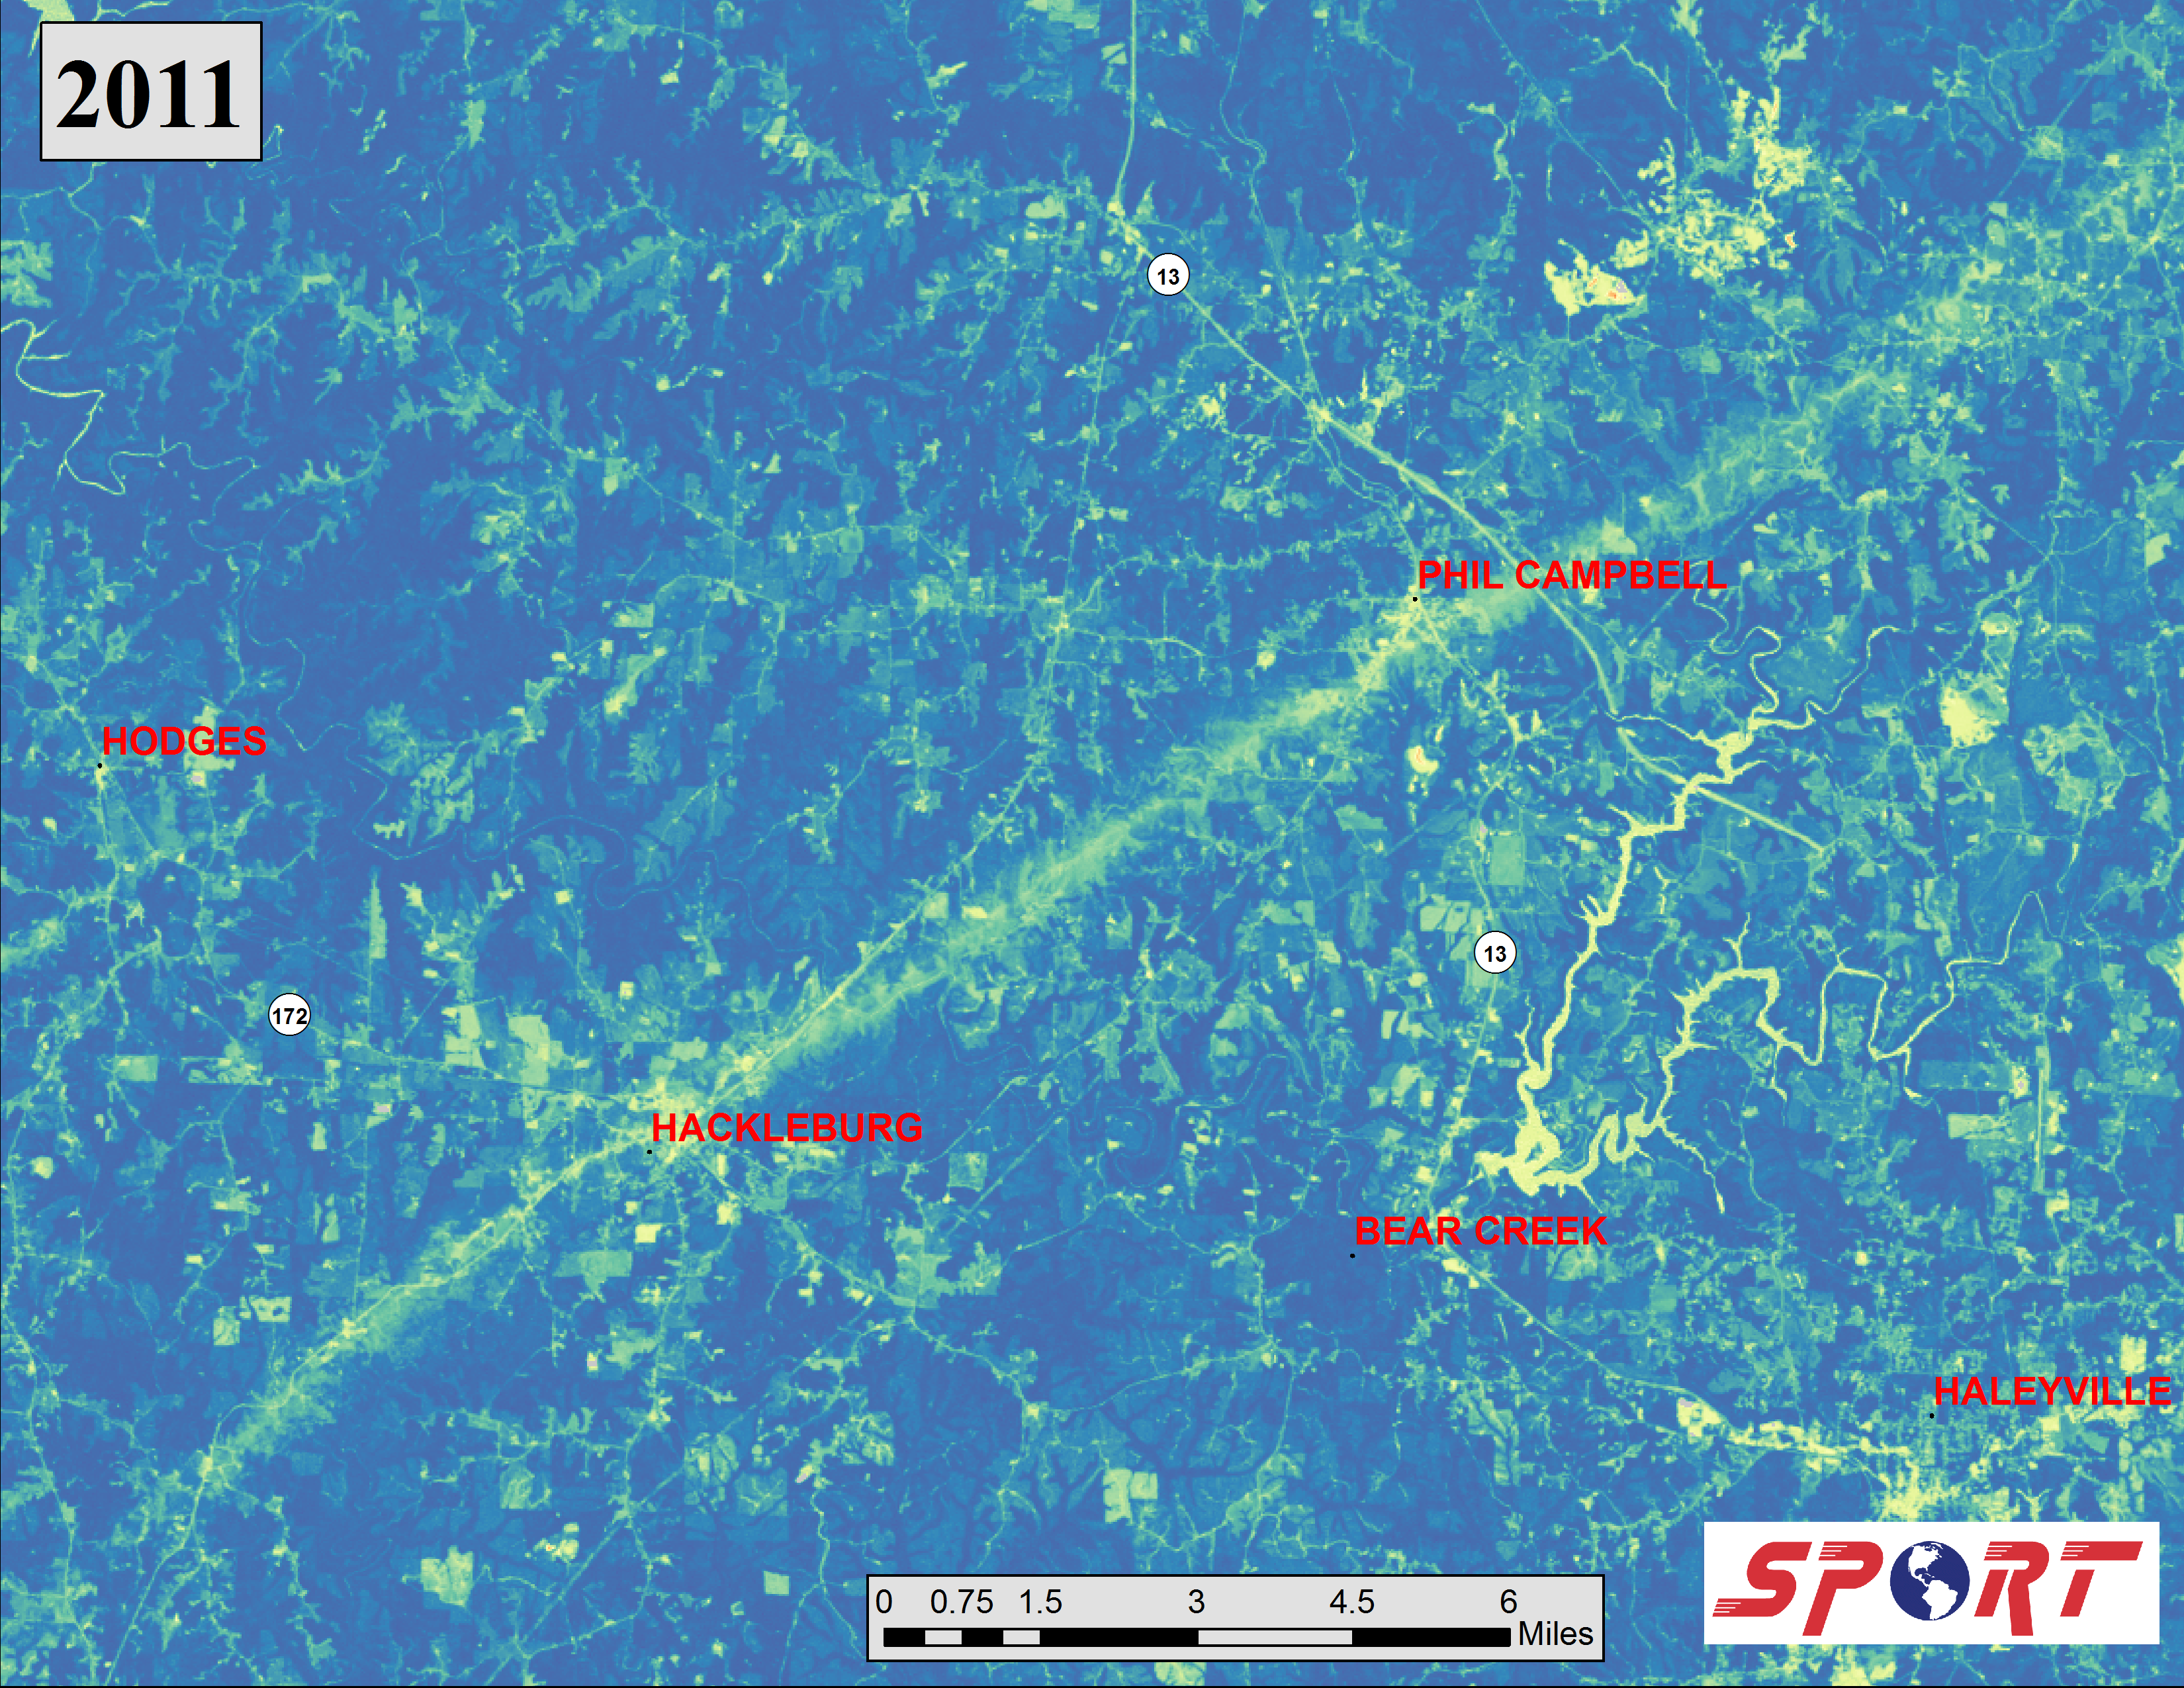
Normalized Difference Vegetation Index (NDVI): The NDVI combines information from the red and near-infrared wavelengths to measure overall vegetation greenness. The resulting NDVI ranges from -1 (water, clouds, non-vegetated surfaces) to 1 (dense, green vegetation). Here, areas with dense and green vegetation are highlighted in deep shades of greens and blues while less dense vegetation, more exposed soils, or damaged vegetation are in shades of lighter yellows or yellow-green. Damage scars are evident in the early years following the outbreak but become less evident over time. In areas affected by tornadoes, new vegetation has begun to replace areas that were damaged, resulting in a restoration of the NDVI, though perhaps with a different type of vegetation (such as ground cover rather than trees).
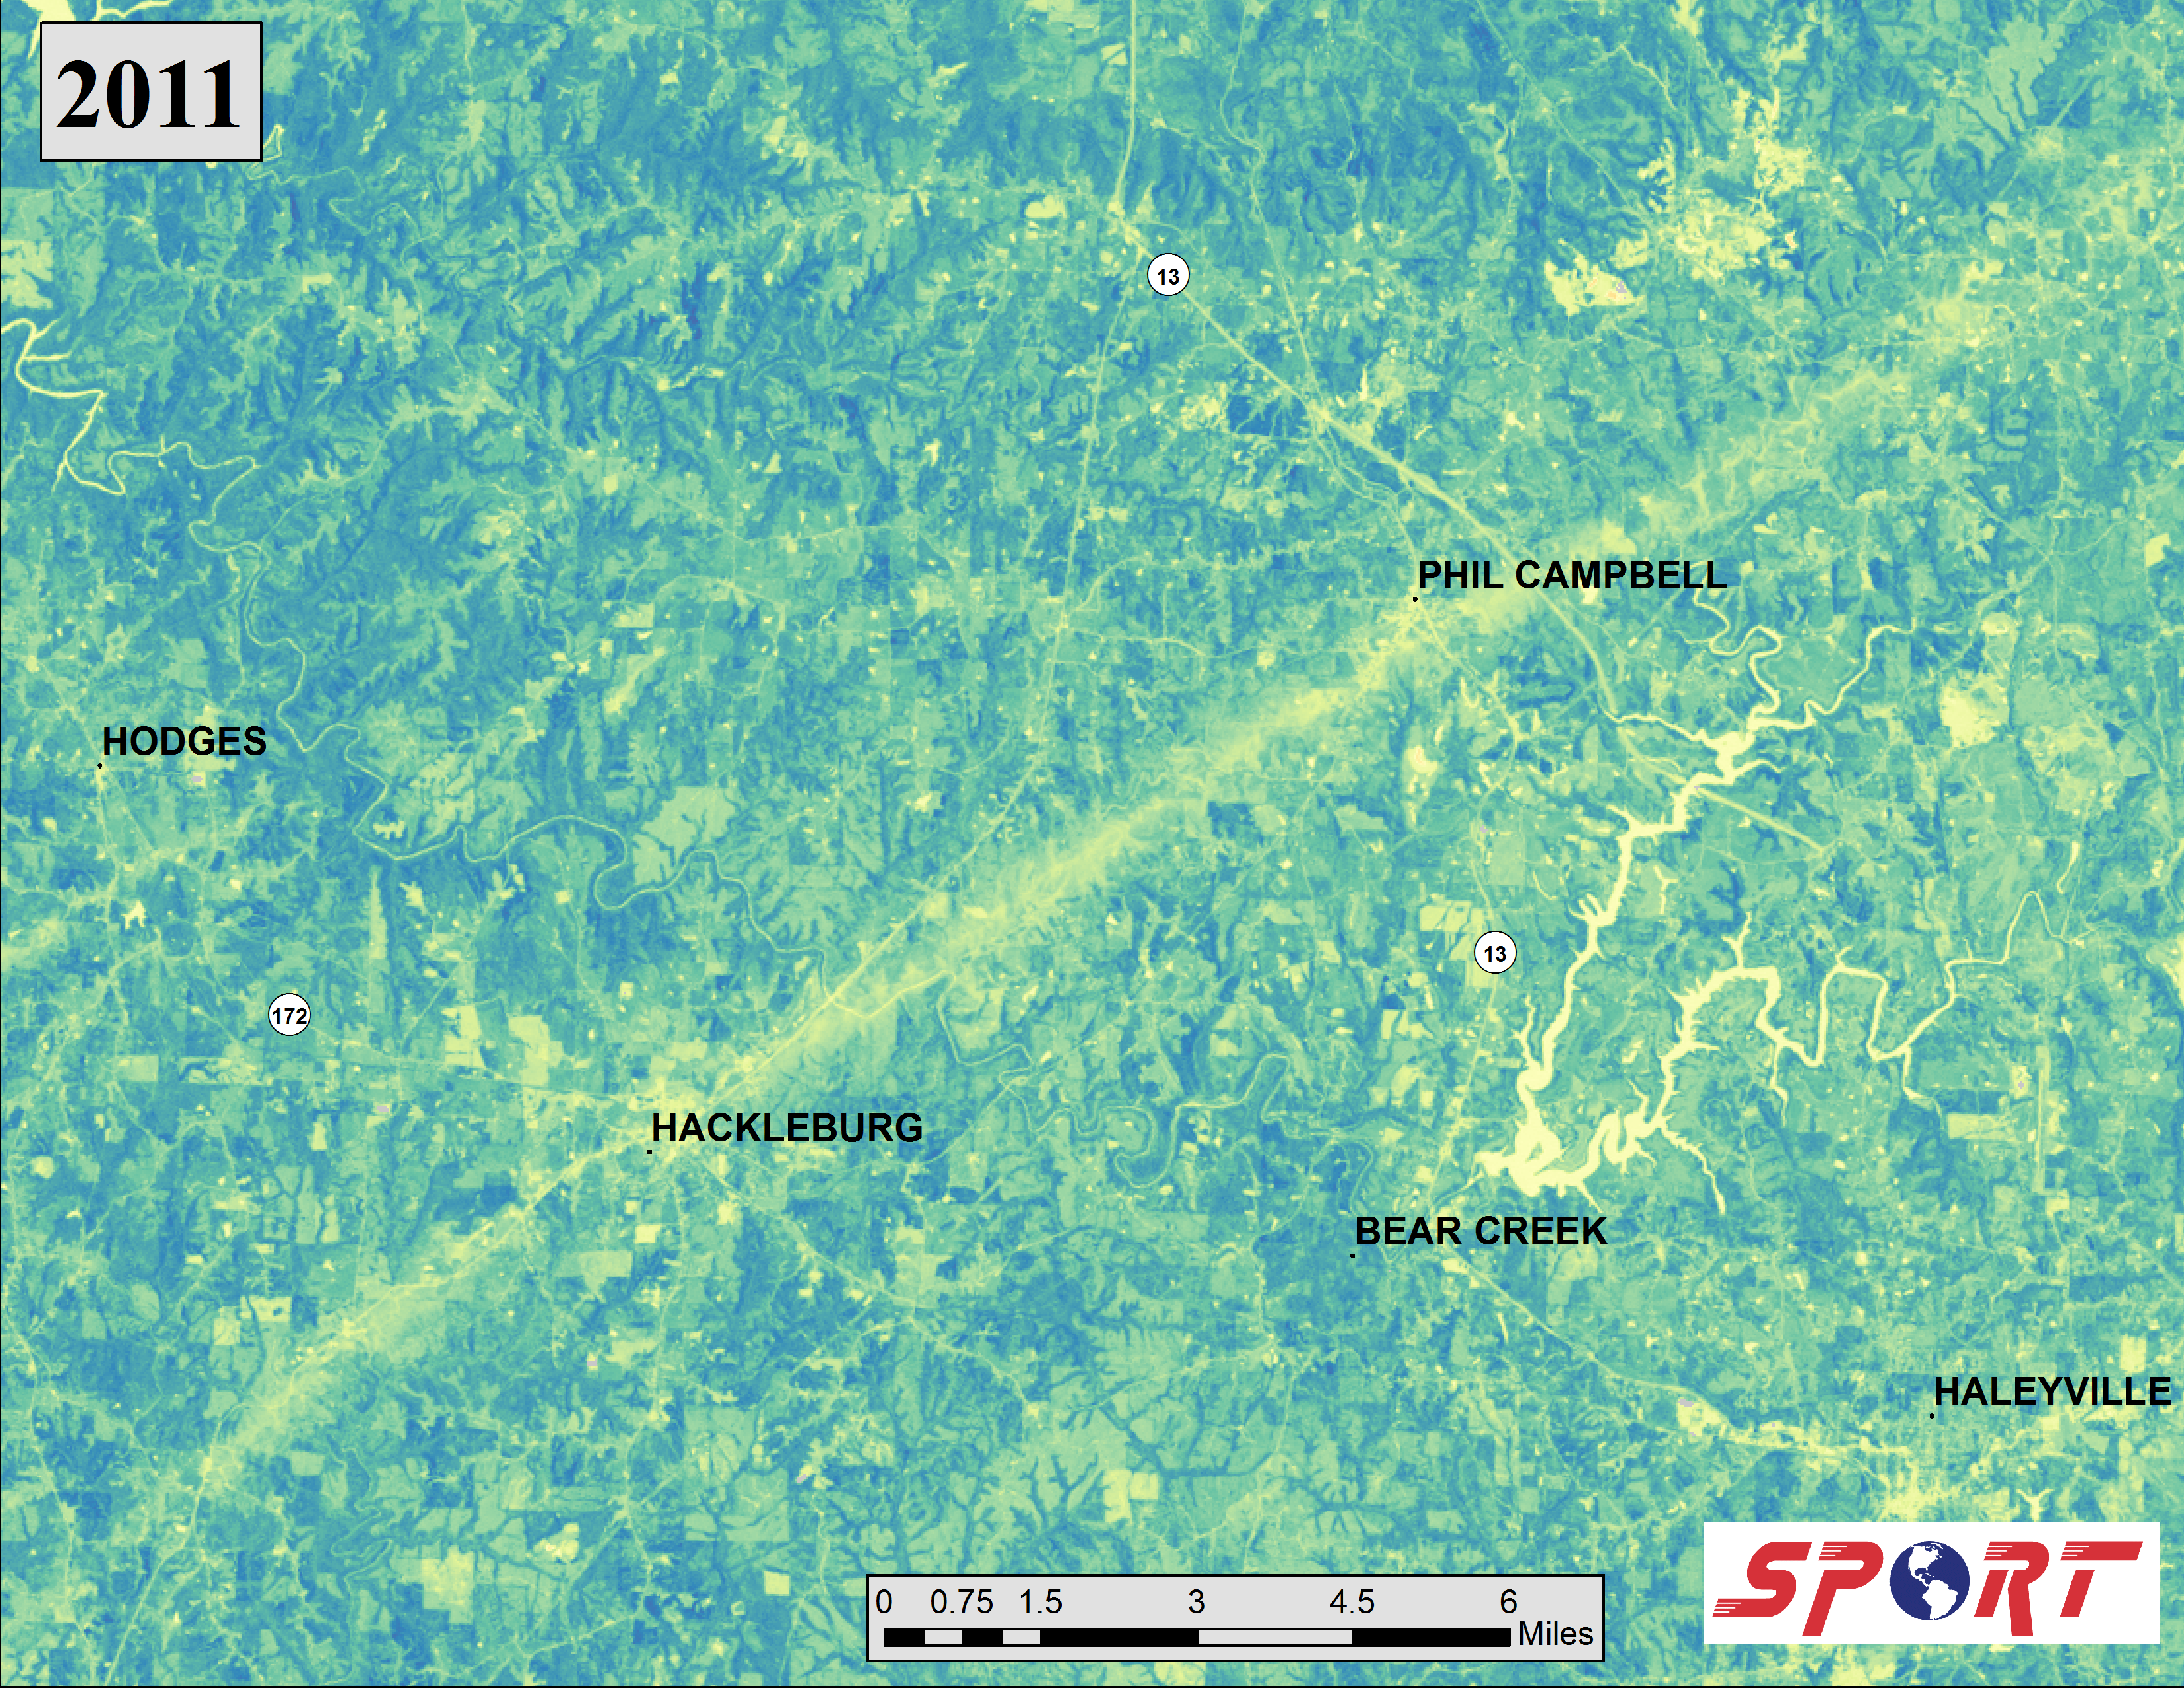
Enhanced Vegetation Index (EVI): The EVI is similar to NDVI but incorporates additional information from the blue visible wavelength to improve contrast in areas with dense, green vegetation. As with the NDVI, damage scars are evident in early years following the 2011 outbreak but become less evident with time. As with NDVI, new vegetation has begun to replace some areas that were damaged, resulting in a reduced coverage of scaring, though scars are still apparent in the true color imagery.