|
Research
Surface Water Detection
AMPR Precipitation Index (API)
Surface Water Detection
Research done post-analysis using information collected during NASA tropical cyclone field studies suggest surface water and flooding induced by tropical cyclone precipitation can be detected and therefore monitored using the 10.7 GHz channel of AMPR. Because the 10.7 GHz is most sensitive to surface water emissivities, AMPR can detect surface water during storms and precipitation systems.
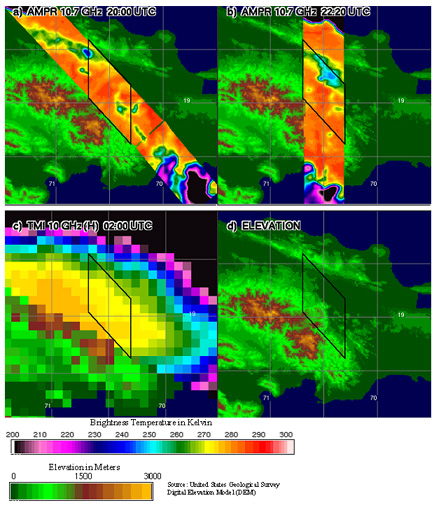
AMPR images from CAMEX-3 around the time Hurricane Georges was making landfall on the Dominican Republic. a) AMPR 10.7 GHz overpass on 22 Sep 1998 near 2000 UTC (heading SE), b) AMPR 10.7 GHz overpass near 2220 UTC the same day (heading N), c) closest TMI 10.7 GHz overpass on 23 Sep 1998 near 0200 UTC and, d) land surface elevation from USGS 30-arc second Digital Elevation Model. Solid black parallelogram dentoes the region where aMPR crossed on both the SE and N pass.
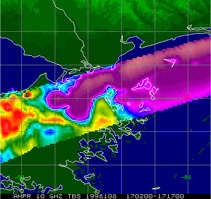
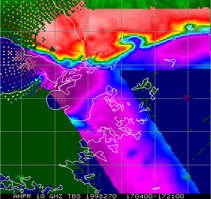
A comparison of before and after images of AMPR crossing the same region demonstrates the utility of AMPR to detect surface wetness. Image to the left is of the Louisiana Delta under dry conditions on 18 Apr 1998 while the image on the right is under wet conditions from storm surge while Hurricane Georges was making landfall on the Gulf Coast on 27 Sep 1998. The left image shows land emissivities and clearly outlines land from ocean. In the right image, there is little to no distinction between land and ocean.
AMPR requires fairly thin vegetation to detect the surface. This study incorporated MODIS Leaf Area Indices to show through what types of vegetation AMPR can monitor the surface.
Paper on AMPR 10.7 GHz channel detection of surface water and inland flooding is currently in submission to Journal of Atmospheric and Oceanic Technology.
Back to top
AMPR Precipitation Index (API)
(see Hood et al., 1995 for a complete discussion of the API)
The AMPR precipitation index descriptions, criteria, and representative rain rates are shown below. Criteria for API rain tests vary across-track; the listed values are applicable at nadir. Rain rates were estimated by applying the Jorgensen and Willis (1982) Z=300R1.35 relationship to the median 1 km altitude reflectivity value for each EDOP/AMPR vertical profile.
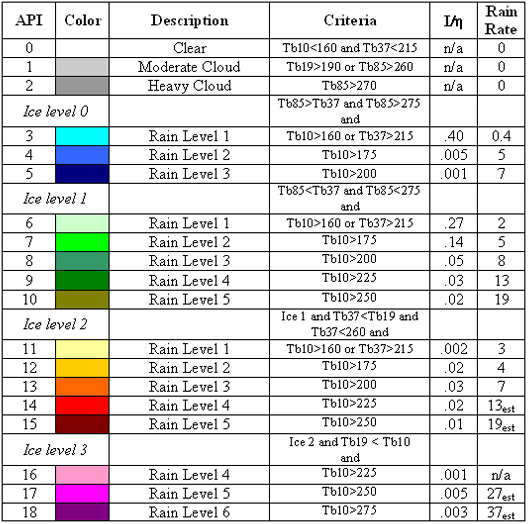
 is the fraction of the index to the total of all rain-only samples ( is the fraction of the index to the total of all rain-only samples ( =231042). =231042).
rrest rain rate (mm/hr) estimated at 4 km altitude due to attenuation uncertainty.
Notes:
Ice Level 0 (No Ice) and Levels 4-6 Rain do not significantly occur and are included in Index 5.
Ice Level 1 (Moderate Ice) and Level 6 Rain does not significantly occur and is included in Index 10.
Ice Level 2 (Heavy Ice) and Level 6 Rain does not significantly occur and is included in Index 15.
Ice Level 3 (Intense Ice) and Levels 1-3 Rain do not significantly occur and are not included.
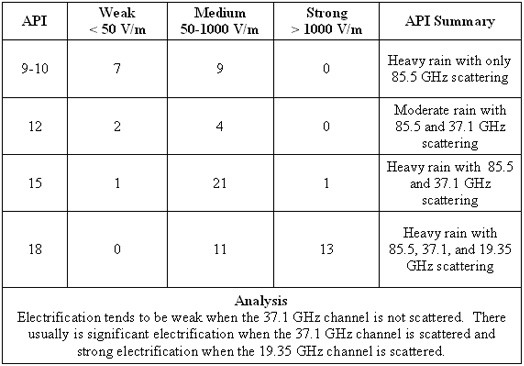
Number of occurrences of weak, medium, and strong vertical electric fields as a function of the maximum API value in the vicinity. Taken from subjective analysis of 11 tropical cyclone and three non-cyclone aircraft missions.

Horizontal mapping of API and projections of 3-D electric field and aircraft location onto (A) longitude-altitude plane, (B) latitude-altitude plane, and (C) longitude-latitude plane is shown. The ‘s’ denotes start of aircraft track (1500 UTC) and the ‘e’ denotes end of aircraft track (1600 UTC). API color scale as in the API table. Electric field and aircraft location are plotted as if projected onto three sides of a box. The projections of the electric field onto the (A) longitude-altitude, (B) latitude-altitude, and (C) latitude-longitude planes are plotted as barbs originating at the aircraft location. A barb extending 1 km above the aircraft track denotes a +1 kV m-1 (positive charge below the aircraft) electric field. Note that the vertical component dominates the longitudinal and latitudinal components of electric field in (A) and (B). Barb lengths are scaled by a factor of 10 in (C) because the horizontal components of electric field are so small.
Back to top
|