Lightning Safety Awareness Week June 21-27, 2020
Lightning Safety Awareness week is in its 20th year within the United States. Each year this week is held in June to remind people of the dangers that lightning can pose to people and infrastructure. Over the last 20 years, there has been a steady downward progression in the number of lightning fatalities within the US from 55 in 2001 to 26 in 2019. Much of this decline is the direct result of awareness generated by NOAA slogans like “When Thunder Roars, Go Indoors” or “See a Flash, Dash Inside” for the deaf and hard of hearing community.
Despite these efforts, North Alabama has seen three lightning fatalities in the last four years. In each case, the victim was near the edges of the precipitation and thunder was audible. Research indicates that approximately 47% of lightning victims are struck after the storm passed their location (Holle et al. 1993). An additional 35% of victims are struck as the storm approached their location. Thus, many of the lightning deaths occur when it is not raining at the victim’s location.
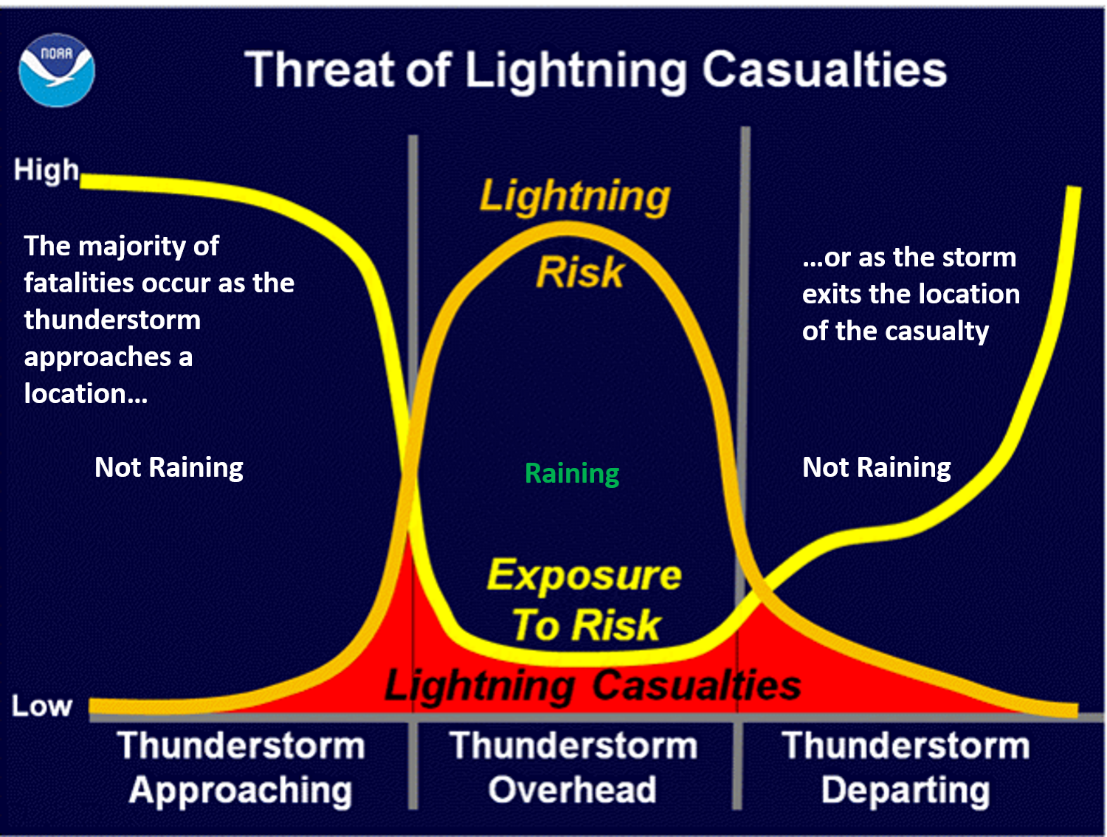
Figure 1 – lightning casualties as a function of lightning risk (number of flashes overhead; orange) versus the exposure of people to the risk (people located outside with nearby storm while its not raining; yellow). Original Image, John Jensenius, NWS Retired, annotation from NASA SPoRT.
Lightning is one of the fundamental focus areas of the Short-term Prediction and Research Transition (SPoRT) Center. The SPoRT team is constantly working to develop new products to improve situational awareness and assessment of lightning risk for operational forecasters and the public. The team works directly with emergency management, forecasters at the National Weather Service, and other partners at Marshall Space Flight Center to work toward improving lightning safety, while mitigating lost time due to lightning protocols.
There are two specific areas in which SPoRT is actively working to improve lightning situational awareness. The first is the development of the Stoplight product, launched in 2018 to help a stakeholder understand when the last lightning to impact their location occurred (Figure 1). The motivation for this product is that the National Weather Service and the National Lightning Safety Council advise a 30-minute rule for when an individual hears the last thunder at their location. It can be difficult to remember exactly when that last lightning flash occurred, so Stoplight provides the user with an easy to read interface that allows them to make the best decision possible based on lightning data. This product has been used at Marshall Space Flight Center’s Emergency Operations Center since 2018. Stoplight is currently being modified and extended into the National Weather Service through a new product named Time Since Last Flash, which merges all available NOAA lightning datasets to produce a unified field across the areas of responsibility of the National Weather Service.
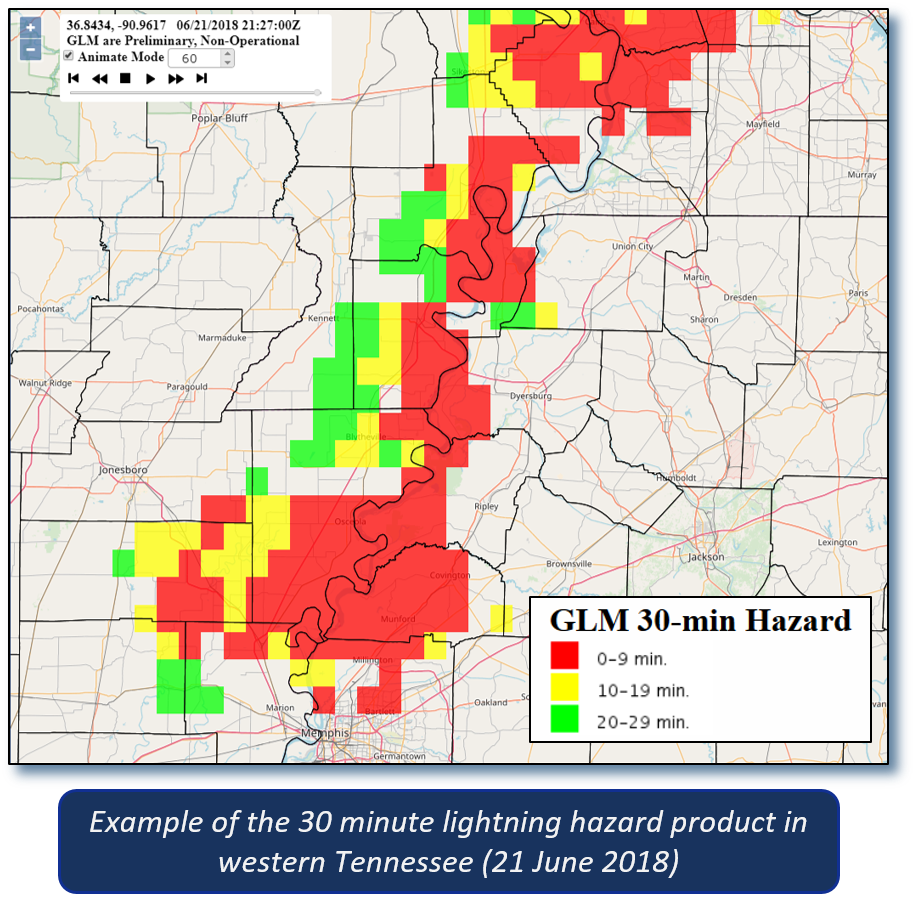
Figure 2 – Example of the GLM stoplight product developed to help end users understand the time of the last lightning flash at their location, so they can return to outdoor activities safely as a storm moves away. Adapted from Stano et al. (2019): https://doi.org/10.15191/nwajom.2019.0707
The second area of growth is the development of a real-time risk assessment that can provide an end user with a depiction of risk due to lightning exposure at any given time. This would allow the end user to make informed decisions, such as when it may be necessary for people to seek shelter before seeing lightning or hearing thunder. The application of different risk tolerability frameworks also provides an opportunity to assess how people may perceive lightning risk in different scenarios. Examples of the lightning risk assessment are included in Figure 3, applied to two of the fatality cases from North Alabama. At the time that both persons were struck, their risk was in the unacceptable category. With more research and development, the hope is that this tool will help continue to reduce the exposure of people to the lightning threat and can be applied to lightning safety scenarios globally.
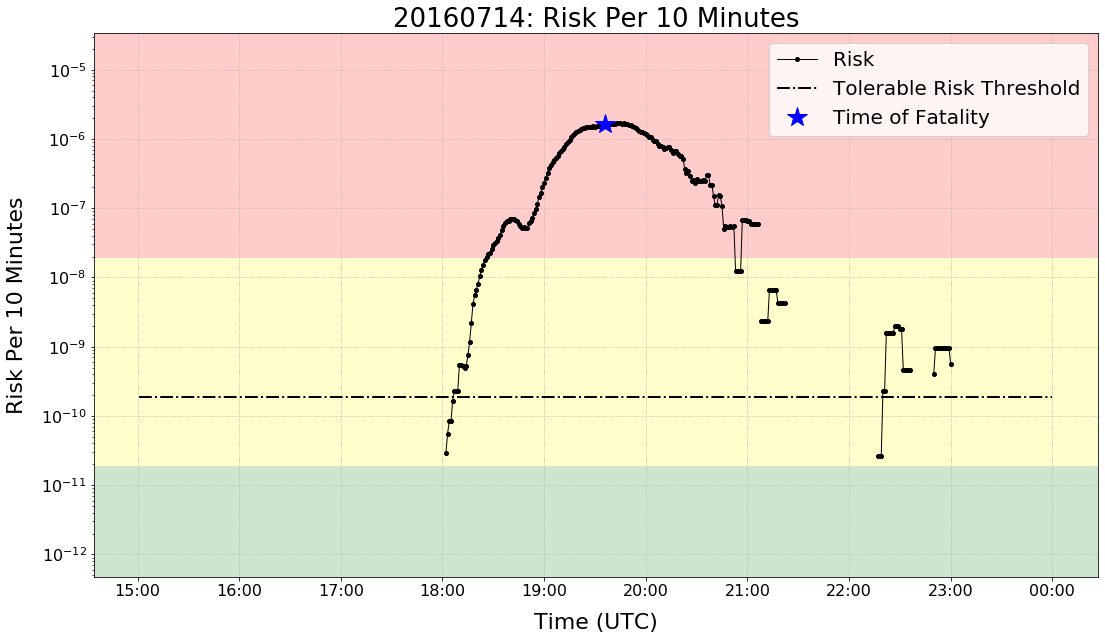
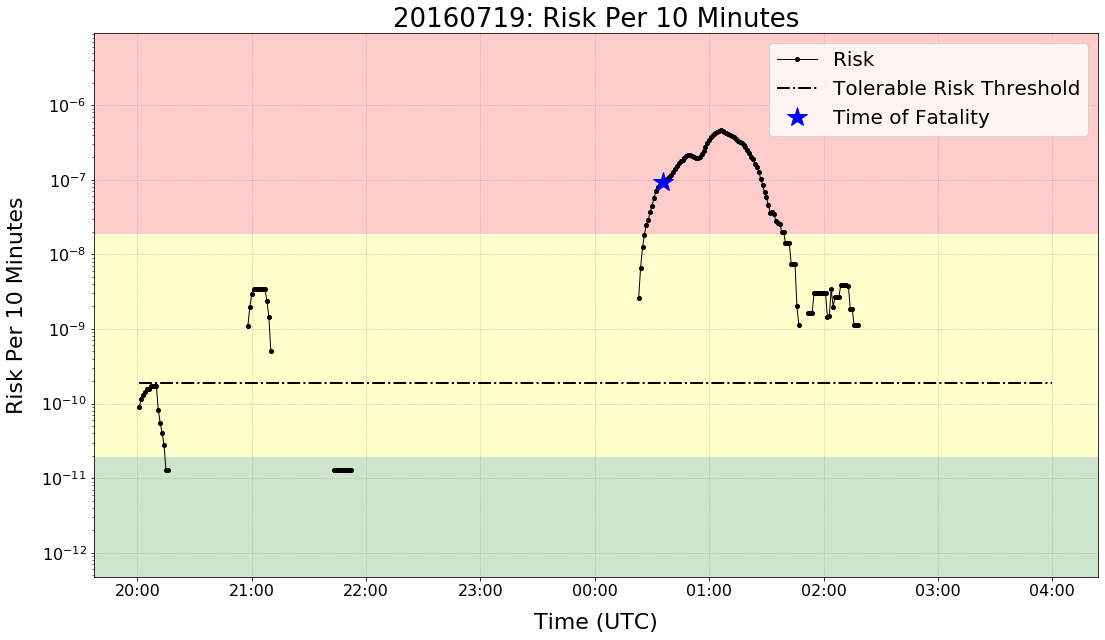
Figure 3 – Lightning risk assessment for the two fatalities in North Alabama during July 2016. The colored backdrop corresponds to risk levels due to lightning: red indicates an unacceptable risk, yellow is a tolerable risk, and green is an acceptable risk. The dashed line indicates an alternate tolerability/decision threshold over which to assess the level of risk. Adapted from Murphy et al. (2020), Weather Climate and Society, conditionally accepted, pending revision.
So, as we move into the heat of summer in the United States, when lightning fatalities are greatest within the United States, be aware of your surroundings, and when Thunder Roars, Go Indoors!
References
National Lightning Safety Council, 2020: http://lightningsafetycouncil.org/
Holle, R. L., R. E. Lopez, R. Ortiz, C. H. Paxton, D. M. Decker, and D. L. Smith, 1993: The local meteorological environment of lightning casualties in central Florida. Preprints, Conference on Atmospheric Electricity, October 1993, St. Louis, MO, Amer. Met. Soc.
Murphy, K. M., E. C. Bruning, C. J. Schultz, and J. Vanos, 2020: Assessing lightning risk in outdoor vulnerable environments, Wea. Clim. and Society , conditionally accepted, pending revision.
Stano, G. T., M. R. Smith, and C. J. Schultz, 2019: Development and evaluation of the GLM stoplight product for lightning safety. J. Operational Meteor., 7 (7), 92-104, doi: https://doi.org/10.15191/nwajom.2019.0707