Exploring Daily Changes in Tropical Cyclone Temperature and Moisture Using NUCAPS Satellite Soundings
Each year, tropical cyclones (i.e., hurricanes, typhoons) develop year-round across the globe, creating potential threats to humanity from extreme winds, rain, and storm surge. Although great strides have been made in both the forecasts of tropical cyclone (TC) track and intensity over the last several decades, predicting short-term (~24-hour) structure and intensity change remains a significant forecast challenge. As part of the tropical meteorology focus area at the NASA SPoRT Center, SPoRT researchers continue to investigate new ways to leverage NASA datasets to improve TC forecasts, both developing products that aid forecasters in their analyses as well as preparing forecasters and other end-users for the next generation of NASA satellites.
One of current projects in the tropical research focus area at NASA SPoRT is exploring the usefulness of applying NOAA Unique Combined Atmospheric Processing System (NUCAPS) satellite soundings to diagnose daily changes in TC thermodynamic structure. The NUCAPS algorithm retrieves vertical profiles of temperature, humidity, trace gases, and cloud properties through a combination of both infrared and microwave instrumentation. NUCAPS soundings are operational on both the Suomi-National Polar-orbiting partnership (S-NPP) and NOAA-20 satellites, as well as the Meteorological Operational (MetOp) A/B satellites. NUCAPS soundings have demonstrated significant value in several applications, including diagnosing the pre-convective environment, locating stratospheric intrusions, identifying the Saharan Air Layer (SAL), and diagnosing cold air aloft. However, these soundings could also be unique assets in observing the tropical environment, particularly the TC environment, as they observe a larger portion of the environment than a single radiosonde launch or dropsonde from reconnaissance aircraft (Fig 1), and fill gaps in times when radiosondes or aircraft reconnaissance are not available.
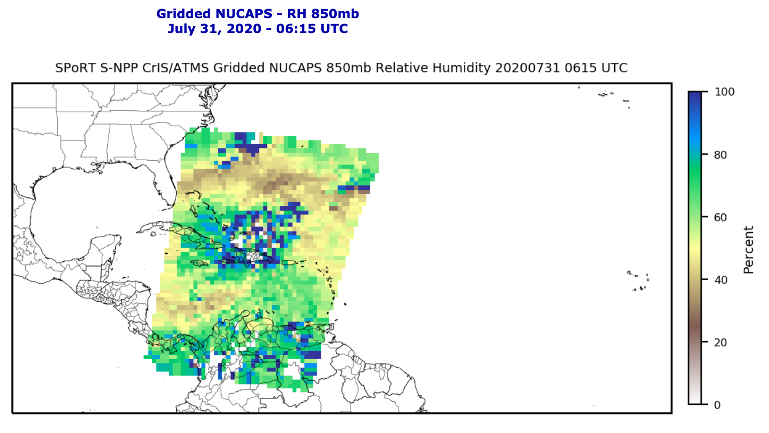
Fig 1. An example of a NUCAPS overpass over Hurricane Isaias (2020), valid at 0615 UTC on 31 July, 2020. Blue/green colors east of the Bahamas and north of Hispaniola represent the moisture associated with Hurricane Isaias, and brown and yellow colors north and west of the storm demonstrate the presence of drier air.
Using a combination of overpasses from S-NPP, NOAA-20, and MetOp A/B, several snapshots of the diurnal cycle over a single storm can be captured using NUCAPS soundings. Such combinations of swaths may be useful in assessing short-term (< 24 hr) thermodynamic changes in a TC. Currently, researchers at SPoRT are exploring viewing NUCAPS soundings in a storm-relative framework, which categorizes each sounding based on the radial distance from the TC center as opposed to its latitude and longitude position. Due to the circular symmetry of the TC circulation, and the preference for certain TC structures such as the eyewall, spiral rainbands, and external convection to exists within certain radial distances from the storm center, this framework allows one to easily assess how the thermodynamic environment around and near these features may change at any given time.
Figure 2 shows an example of temperature anomaly profiles in both the morning and the afternoon for Tropical Storm (TS) Fay on 8 July, 2020. These profiles are composites of all NUCAPS soundings that fell within a radial distance of 100-200km, 200-300km, and 300-400km from Fay’s center, where the mean profile over the course of the day for that radial distance has been removed to yield the anomaly profile. Comparing the morning profile (00-03 local time, or LT) to the afternoon profile (12-15 LT), a clear diurnal cycle is evident in both the temperature and moisture soundings (Duran et. al 2020). Nearly equal and opposite changes are observed throughout the depth of the troposphere, demonstrating the effect that radiation has on the TC environment.
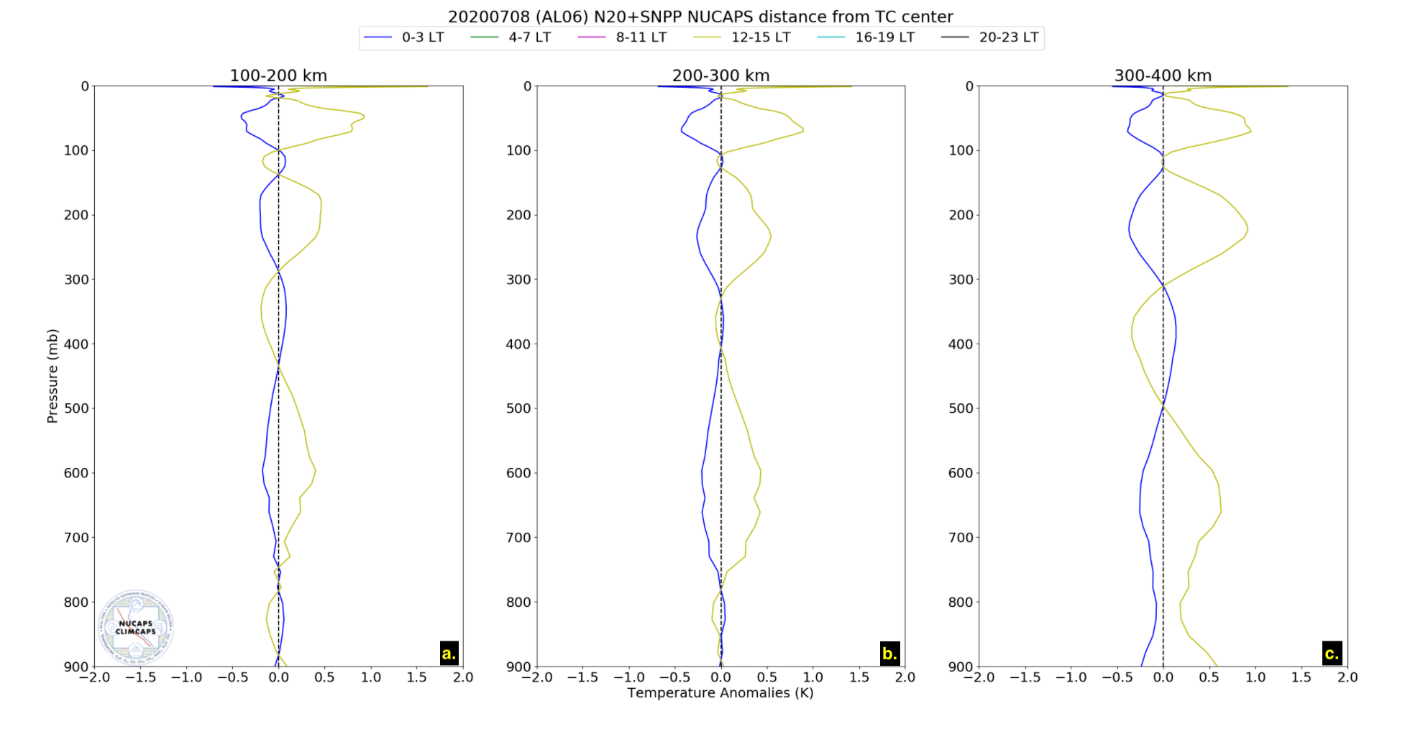
Figure 2: Temperature anomaly profiles for TS Fay on 8 July, 2020, averaged from 00-03 LT (blue lines) and 12-15 LT (yellow lines) in radial bins extending from (a) 100-200km, (b) 200-300km, and (c) 300-400 km. Images produced in collaboration with Rebekah Esmaili, Science and Technology Cooperation (STC)/Joint Polar Satellite System (JPSS).
TC radial anomalies can also be plotted as plan-view images instead of vertical profiles. Doing so allows one to easily identify regions of moist/dry air, as well as gradients in temperature and moisture (Fig 3). Averaging from 700-400mb and 12-15 LT for TS Fay on 8 July, 2020, dark brown colors show a significant amount of dry air north of the storm, while lighter brown colors show drier air potentially penetrating near the core of the TC circulation. Comparing this to the GOES low-level water vapor imagery at 00 UTC on 9 July, 2020 shows that the dry air indicated in the radial anomalies lines up well with lower levels of water vapor from GOES. One benefit, however, of NUCAPS radial anomalies in this context is that one can identify and quantify the amount and location of dry air vertically in the atmosphere.
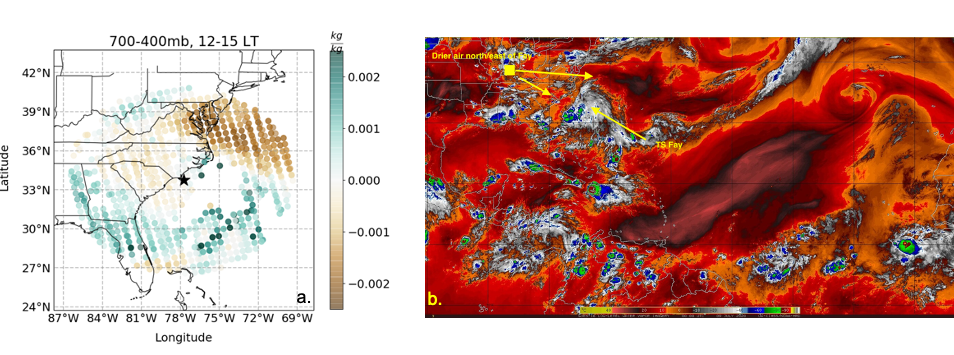
Figure 3: (a) Water vapor concentration anomalies averaged from 12-15 LT and from 700-400 mb in TS Fay on 8 July, 2020. (b) GOES low-level water vapor imagery valid at 00:00 UTC on 9 July, 2020. Left image produced in collaboration with Rebekah Esmaili, STC/JPSS.
These experimental products show promise in using NUCAPS soundings to help diagnose short-term changes in TC thermodynamic structure, and researchers at SPoRT, along with collaborators at the Science and Technology Corporation (STC) and the Joint Polar Satellite System (JPSS), continue to assess their utility throughout the 2020 Atlantic hurricane season. Real-time products are available online , and more information about radial anomalies is given here.
References
Duran, E. L., E. B. Berndt, and P. Duran (2020): Observation of the Tropical Cyclone Diurnal Cycle Using NUCAPS Satellite Soundings. Mon. Wea. Rev., in prep.