Science From Space: A Look at the SLS Hot Fire Test
On March 18, 2020, NASA tested the core stage of Space Launch System (SLS), the largest rocket NASA has ever built, at John C. Stennis Space Center in southern Mississippi. This test consisted of firing the four RS-25 engines for more than 8 minutes producing a prolific, explosive plume under crystal clear skies. We wanted to see what this plume of success, composed mostly of water, looked from satellite imagery commonly used for weather forecasting and research.
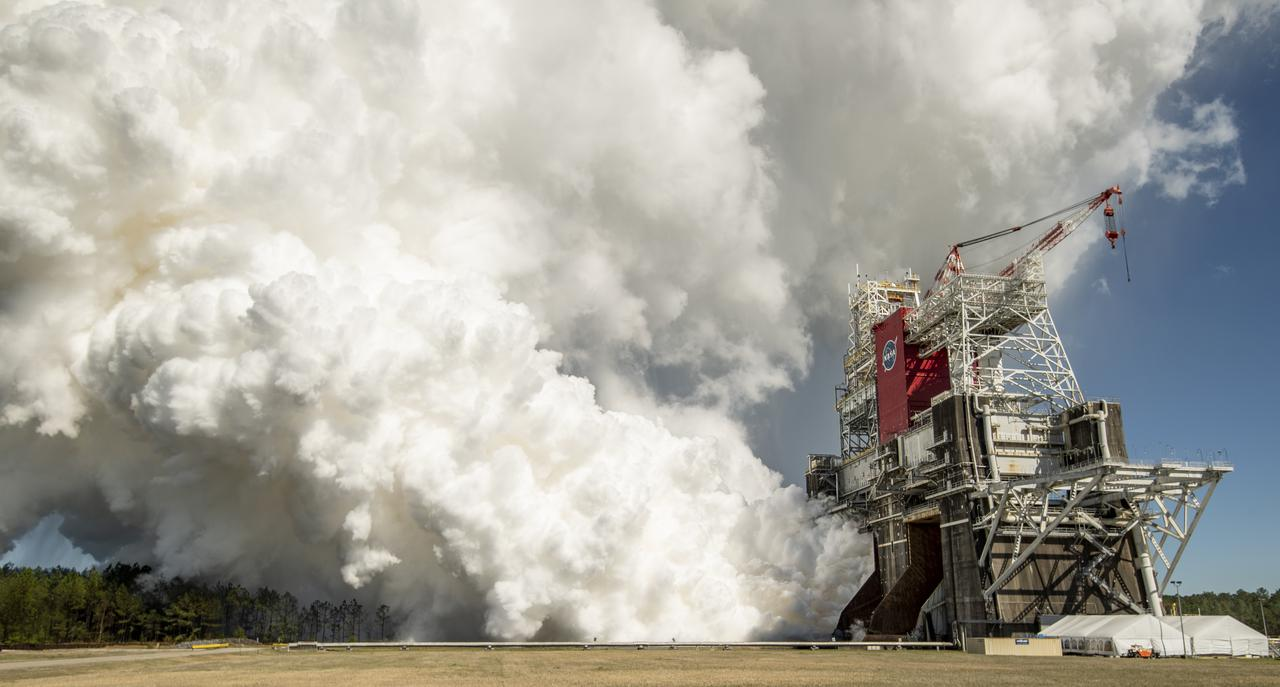
Figure 1. A view from the ground of the SLS Hot Fire test on March 18, 2021 at Stennis Space Center (NASA/Robert Markowitz)
The next-generation NOAA/NASA Geostationary Operational Environmental Satellite (GOES) East, launched in 2017, provides improved imagery with the Advanced Baseline Imager (ABI) onboard detecting surface and atmospheric features at high temporal and spatial resolution. These observations are downlinked by the GOES-R Rebroadcast Receiving Station at MSFC and used to support science, applications, and data science at MSFC, Langley Research Center in Virginia, and Ames Research Center in California.
Several of the ABI’s sixteen spectral bands aboard GOES-East were able to easily detect the intense plume, likely composed of condensation, from 22,236 miles above the surface. The easiest spectral channels to interpret are those in the visible portion of the electromagnetic spectrum as they observe reflected solar radiation as viewed by the human eye. The red visible channel (Channel 2, 0.64 µm) has the highest spatial resolution of the ABI bands at 500 m. GOES-East ABI acquires a new image over the United States every 5 minutes and acquired two images during and immediately following the Hot Fire test. The first image was acquired at 2041 (4 minutes into the test) capturing the plume as a very bright and white feature, like the clouds in the north part of the image. The second image (2046 UTC) was acquired about a minute or so after the test had finished. While the plume still appears, it is not as bright due to gradual thinning and mixing with the surrounding air. The plume is no longer visible in the 2051 UTC image.

Figure 2. GOES-East Red Visible Band (Channel 2, 0.64 µm) view of the plume from the SLS Hot Fire Test at Stennis Space Center on March 18th, 2021.
Figure 3. GOES-East Near-Infrared Band (Channel 3, 0.85 µm) view of the plume from the SLS Hot Fire Test at Stennis Space Center on March 18th, 2021
The plume also appeared with high contrast in two other GOES-East ABI channels. Channel 3 is the 0.85 µm near-infrared channel. This channel is coarser in spatial resolution (1 km) and is colloquially known as the “veggie” channel, as land surface and vegetation reflects solar radiation at this wavelength more than those in the visible range (the red and blue channels). Therefore, the surface appears brighter than Channel 2 in Figure 3. The smoke plume and clouds still appear bright white as they reflect more incoming solar radiation than the surrounding land surface.
Finally, the Channel 5, or the 1.6 µm short-wave channel, captures the plume as well. This channel is typically used for discriminating water and ice particles in clouds during the daytime. Ice particles will absorb this wavelength whereas water particles reflect this wavelength. Since the plume is bright (nearly white) in the image, the satellite suggests that the plume is made up mostly of liquid water particles which is expected this time of year near the surface. The short-wave infrared bands also detect emitted radiation, meaning heat signature such as fire hotspots can be detected, especially at night when there is less solar reflection. Therefore, it is possible that the high temperature of the plume is enhancing its signature in the imagery. ABI channel 6 (2.2 µm; not shown) is another shortwave channel that is used for cloud particle size during the day and is sensitive to moderately intense fire hotspots with the hottest signatures are observed by the 1.6 µm channel. Given the composition and heat intensity of the plume, only a weak signal was observed in the 2.2 µm imagery.
Figure 4. GOES-East Shortwave Infrared Band (Channel 5, 1.6 µm) view of the plume from the SLS Hot Fire Test at Stennis Space Center on March 18th, 2021
While the GOES ABI imagery is typically used for operational weather forecasting, their application is much broader, enabling scientific analysis from space and improving model forecasts through data assimilation. This new generation of GOES satellites allows for monitoring, detecting aviation hazards such as fog and dust at high temporal resolution, and advanced channels to facilitate the detection of cloud characteristics and microphysics. Lastly, the increased number of bands allows for the derivation of multispectral composites to quickly identify features without interrogating multiple bands.