NASA SPoRT-LIS shows excessive loss of soil moisture associated with record low Mississippi River
Rivers are parched across the eastern third of the United States. The Mississippi River is experiencing exceptionally dry beds and record low gage heights dating back to the 1950’s. NASA SPoRT’s Land Information System (SPoRT-LIS) 6-month difference in total column Relative Soil Moisture (RSM) depicts a decrease in the percent saturation of soil moisture by more than 32 units across the Mississippi River Valley since April. The Mississippi River’s major tributaries include the Ohio, Missouri, Arkansas, Illinois, and Red river basins, all of which are encompassed within the dark brown color (at least 24% loss) on the map in Figure 1.
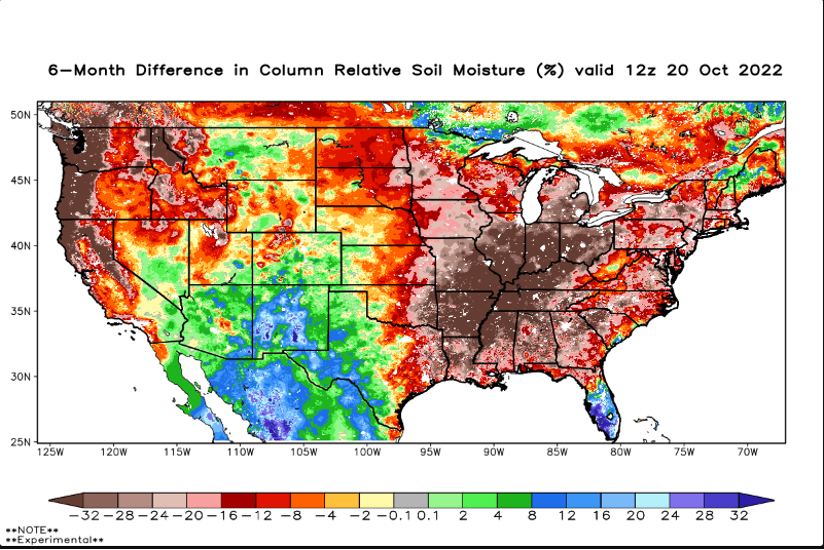
Figure 1. SPoRT-LIS 6-month difference in total column Relative Soil Moisture shows greater than 32 units of decrease in the percent soil saturation across the Mississippi River Valley.
The 1-year difference in total column RSM further depicts a much drier Midwest and Mississippi River Valley versus this time last year (Figure 2). This region has consistently been drier for both the summer and fall of 2022 compared to 2021. The animation in Figure 2 shows a consistent signal in the year-over-year soil drying across much of the southern and eastern United States, contributing significantly to the decline in overall streamflow in the Mississippi River.
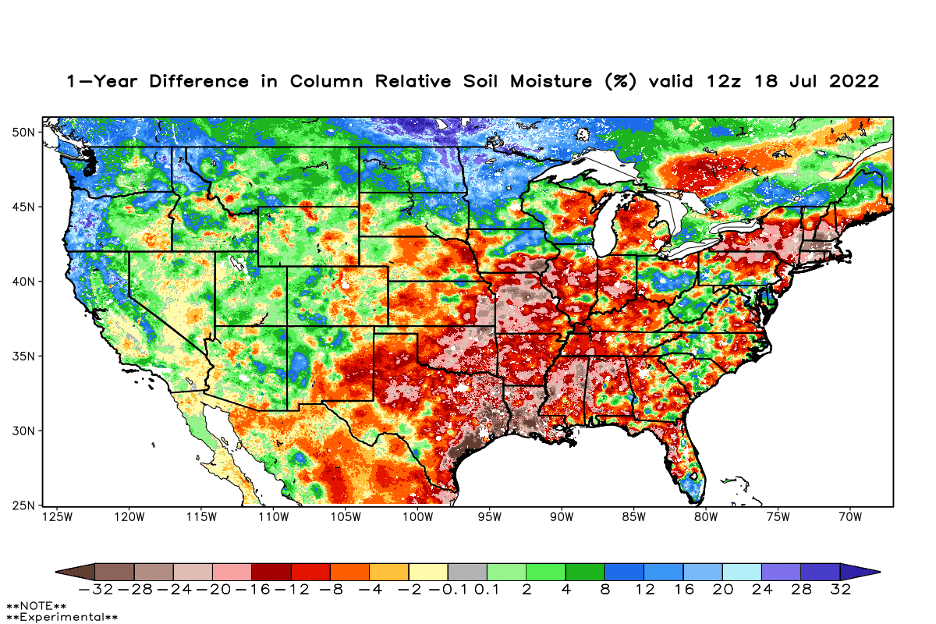
Figure 2. NASA SPoRT’s LIS 1-year difference in column RSM depicting drier soils in 2022 as compared to 2021.
Meanwhile, the 3-month total column soil moisture percentile degradation, indicating soil moisture conditions relative to a climatological normal spanning 1981-2013, has intensified across the Midwest. This is impacting the upstream river basins of the Mississippi River.

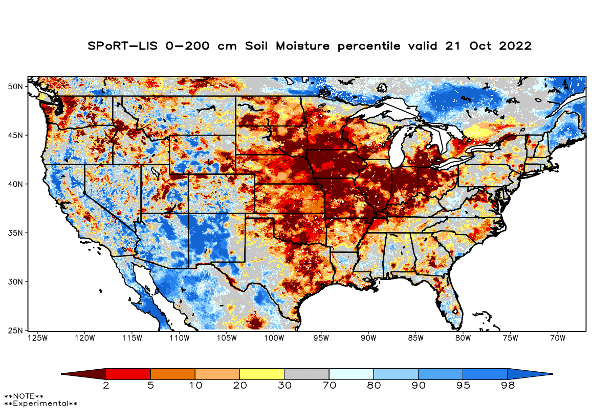
Figure 3. The SPoRT-LIS soil moisture percentile product has dramatically dried out the soils in the Midwest over the past 3 months.
On the latest United States Drought Monitor, the Arkansas, Missouri, Illinois, Ohio, and Red rivers that feed into the Mississippi River are all experiencing either a D2 (Severe Drought), D3 (Extreme Drought), or D4 (Exceptional Drought) stage due to lack of rainfall as shown in Figure 4. This is further aiding in the record low gage height the Mississippi River is currently experiencing.
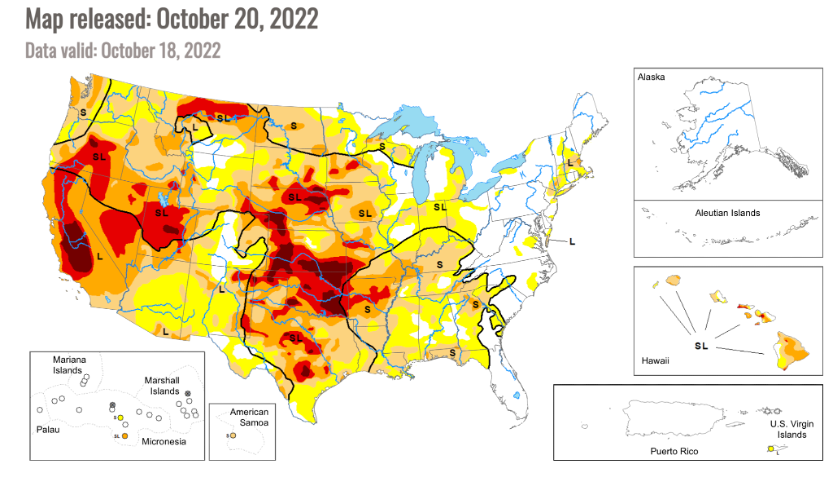
Figure 4. The Arkansas, Missouri, Illinois, Ohio, and Red rivers are experiencing at least a Severe Drought according to the latest United States Drought Monitor.
The United States Geological Survey’s (USGS) Mississippi River gage at Memphis, Tennessee, shows a decline in gage height from 30.71 feet on March 9th down to a record low of -10.72 feet reported on October 20th (Figure 5). This decline is attributed to the lack of rainfall in the Ohio, Missouri, Arkansas, Illinois, and Red river basins, where these rivers and streams eventually flow into the Mighty Mississippi. The minimum operating river height at Memphis is -12 feet, thus the Tennessee Valley Authority has started releasing more water from the Tennessee and Cumberland Rivers in order to increase river heights downstream in the Ohio and Mississippi Rivers.
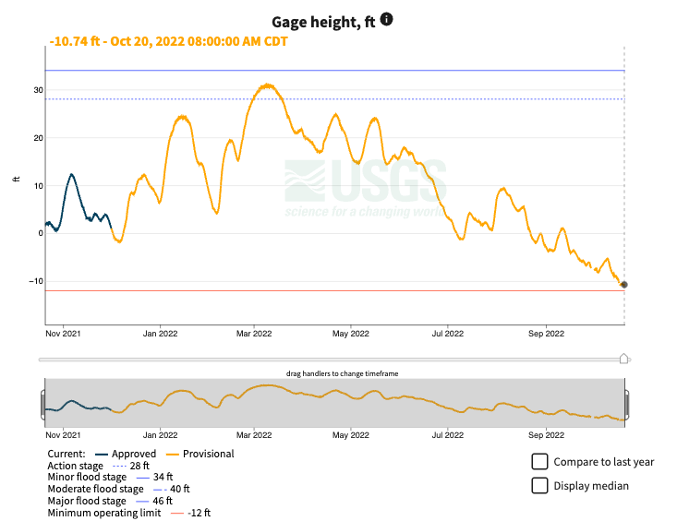
Figure 5. USGS river gage height information for the Mississippi River at Memphis, Tennessee.
Over the past 6 months, the National Weather Service’s Advanced Hydrologic Prediction Service (AHPS) Quantitative Precipitation Estimates (QPE) show a departure of -4 to -6 inches from normal rainfall accumulations over the lower Mississippi River Valley shown in Figure 6. This observation is consistent with the extremely dry soil depicted in the SPoRT-LIS product from Figure 1.
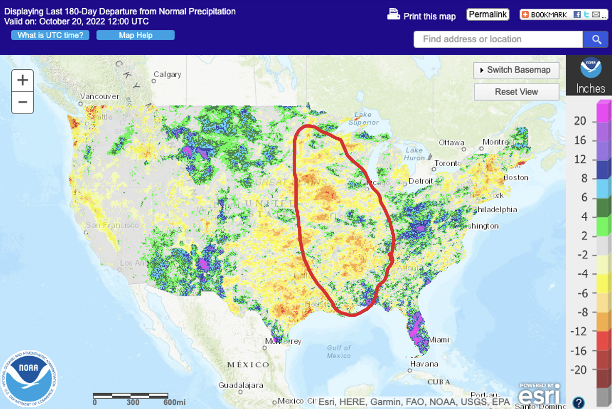
Figure 6. The AHPS departure from normal precipitation over the 180 day period ending October 20th, 2022.
Fall is particularly known as the primary dry season across much of the United States. The Fall 2022 season, however, started off exceptionally dry in September and the first half of October. Less than 1 inch of rain fell across parts of Illinois, Indiana, Kentucky, Arkansas, Mississippi and Louisiana indicated by the blue and light green color shown by the AHPS QPE in Figure 7. This again, shows how the SPoRT-LIS soil moisture can further aid in detecting anomalously dry soil conditions.
Figure 7. The AHPS precipitation estimates over the 30 day period ending October 20th, 2022.
About SPoRT
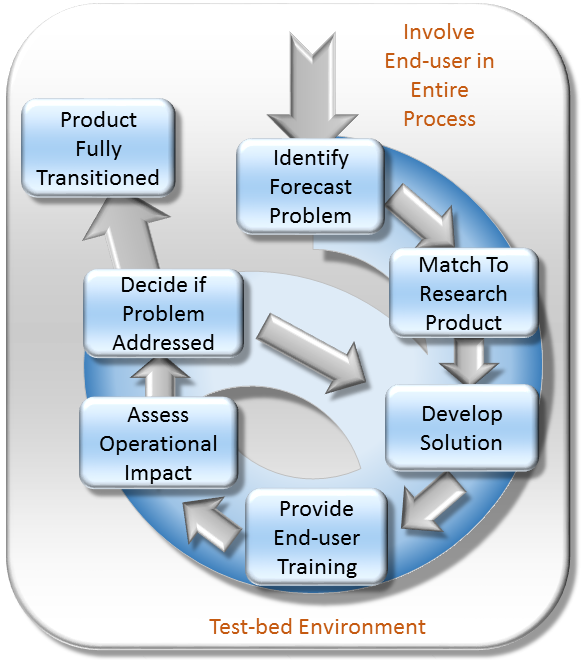
The Short-term Prediction Research and Transition (SPoRT) center at NASA's Marshall Space Flight Center in Huntsville, AL is a NASA-funded activity with a vision of accelerating the translation of NASA science to applications by collaborating with researchers, innovators, and stakeholders. SPoRT was established in 2002 and is funded under the NASA Earth Science Division Research and Analysis Program’s Weather and Atmospheric Dynamics Focus Area. Therefore, SPoRT’s early focus was on transitioning NASA products to the operational weather community to improve short-term forecasting with end users within the operational weather community (e.g. National Oceanic and Atmospheric Administration National Weather Service). Today SPoRT focuses on applied research and applications in 6 focus areas that span weather, atmospheric, and land surface topics with partnerships across government, academia, and the private sector (see Collaborative Partners). A research-to-operations/operations-to-research paradigm (figure below) has been the basis for transitioning over 40 satellite products to stakeholders over 20 years. The main goals of the SPoRT paradigm include (1) early and intentional interaction with stakeholders, (2) identifying and/or developing user-driven science solutions from NASA observations and research capabilities, (3) timely delivery of data products for early stakeholder testing and feedback, (4) integration of data products and capabilities in user formats, visualizations, and display systems, (5) targeted applications-based training highlighting use cases, examples, product advantages and limitations, (5) stakeholder assessments and product testing, and (6) prioritizing operations to research feedback to meet users’ needs and facilitate the sustained use of NASA data in applications. The SPoRT paradigm enables intentional interaction between scientists and stakeholders throughout the research-to-applications/applications-to-research lifecycle to develop innovative solutions through an iterative process that meet stakeholder needs, are tailored for their application, and promote sustained use of NASA observations and research capabilities. SPoRT values innovation, collaboration, and engagement to bridge the gap between science and applications and maximize the benefit of NASA data for operations, applications, and decision making.

Responsible Official: Dr. Gary Jedlovec (gary.jedlovec@nasa.gov)
Page Curator: Paul Meyer (paul.meyer@nasa.gov)
Support Disclaimer